Question 12
Question 15
Question 22
Question 23
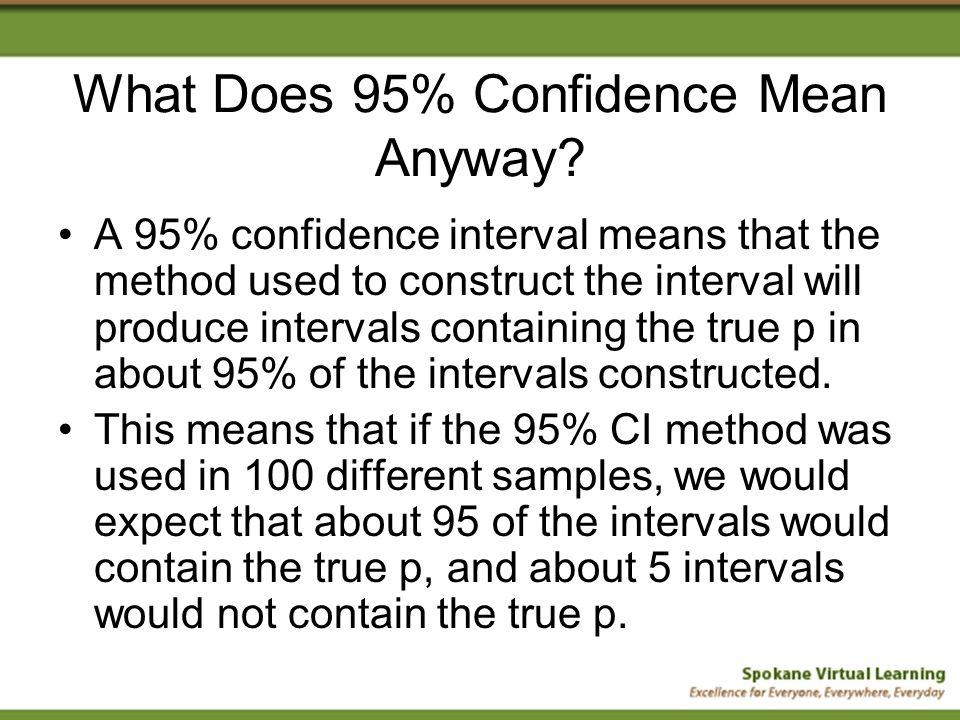
95% confidence interval of a sampling
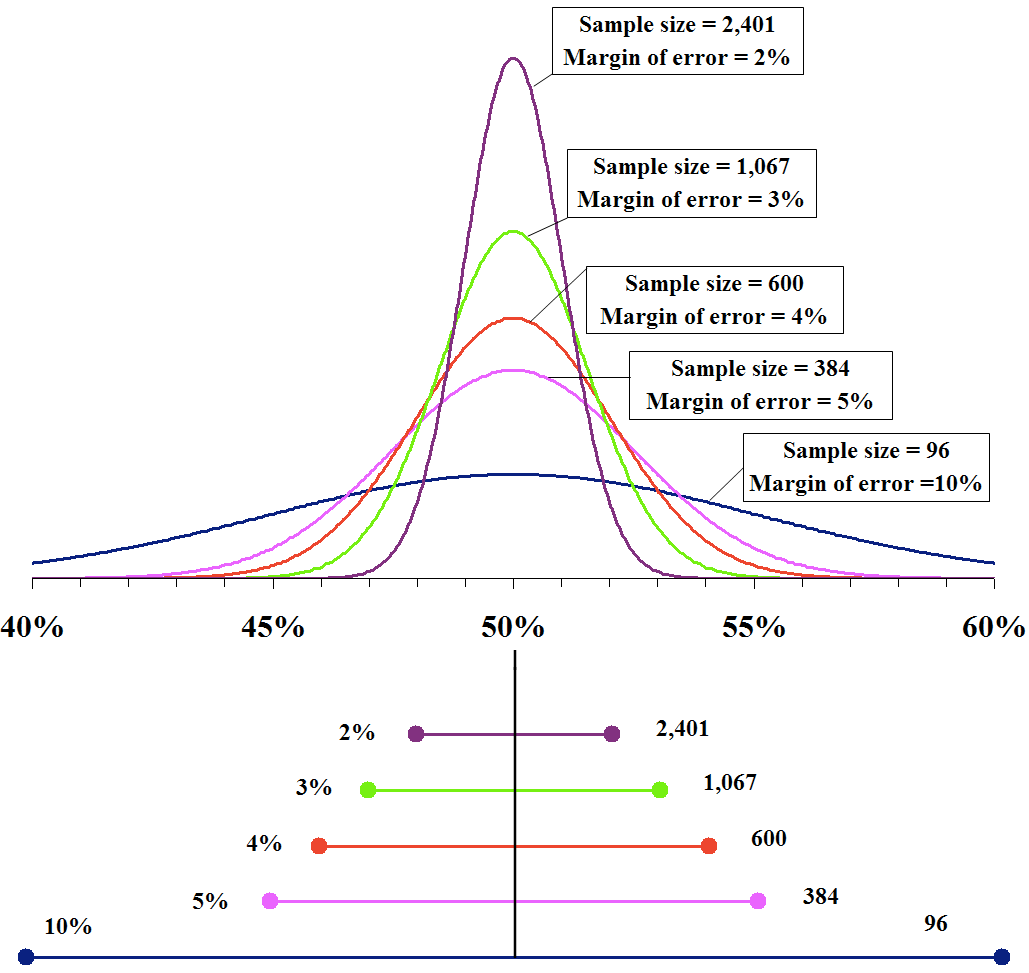
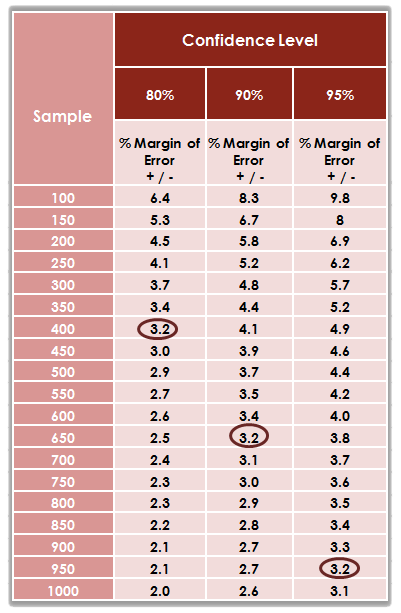
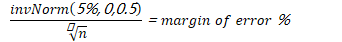
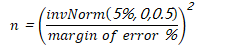
Margin of error vs. sample size at different confidence level
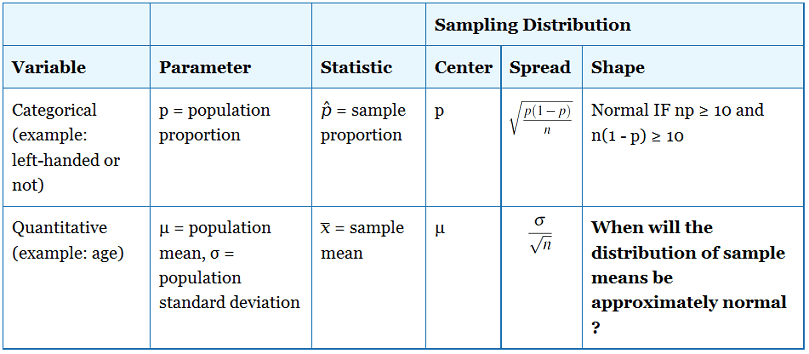
Equation
Question 25
Question 26

Question 27
Question 30
Question 33

Question 38
Question 40
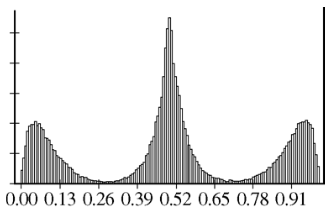
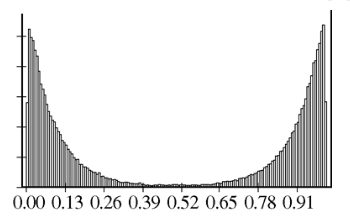
Original data
Sampling distribution of the sample mean with sample size = 2