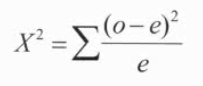
Chi-Squared Goodness of Fit Test
One categorical variable with counts (or proportion) in each category
We have seen: products are produced by two machines, machine A produced 15 defective parts in a run of 280, while machine B produced 10 defective parts in a run of 200. Is there a difference in the reliability of these two machines?
New question type: products are produced by three machines, machine A produced 15 defective parts in a run of 280, while machine B produced 10 defective parts in a run of 200. Is there a difference in the reliability of these machines?
Practice Question 1
In the past, for a large introductory statistics course, the proportions of students that received grades of A, B, C, D, or F have been, respectively, 0.15, 0.35, 0.30, 0.10, and 0.10
This year, there were 200 students in the class, and following grades were given:
| Grade | A | B | C | D | F |
|---|---|---|---|---|---|
| Number | 51 | 79 | 61 | 8 | 1 |
Test to see whether the distribution of grades this year was different from the distribution in the past?
Hypothesis
H0: PA = 0.15, PB = 0.35, PC = 0.30, PD = 0.10, PF = 0.10
H1: at least one p does not fit the distribution
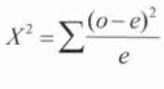
Calculate expected values
| Grade | A | B | C | D | F |
|---|---|---|---|---|---|
| Observed | 51 | 79 | 61 | 8 | 1 |
| Expected | 30 | 70 | 60 | 20 | 20 |
Conditions
Random
Independent
Count: At least 80% of the expected counts are greater than 5 and none are less than 1
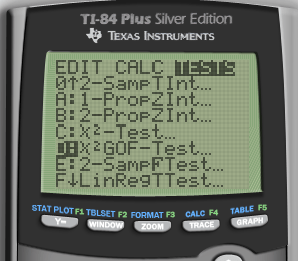
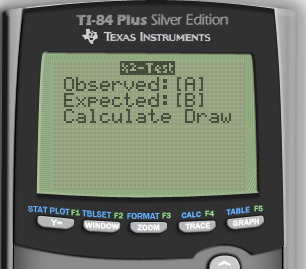
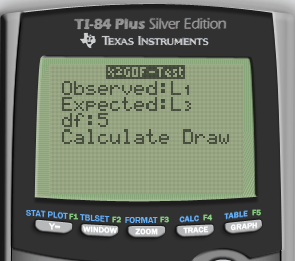
Calculate
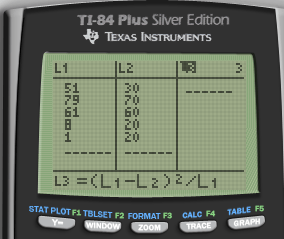
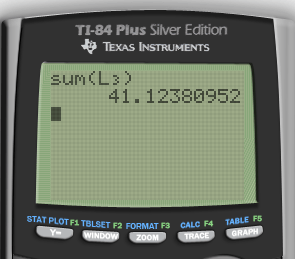
Calculate by calculator
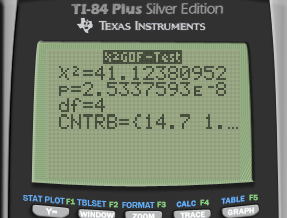
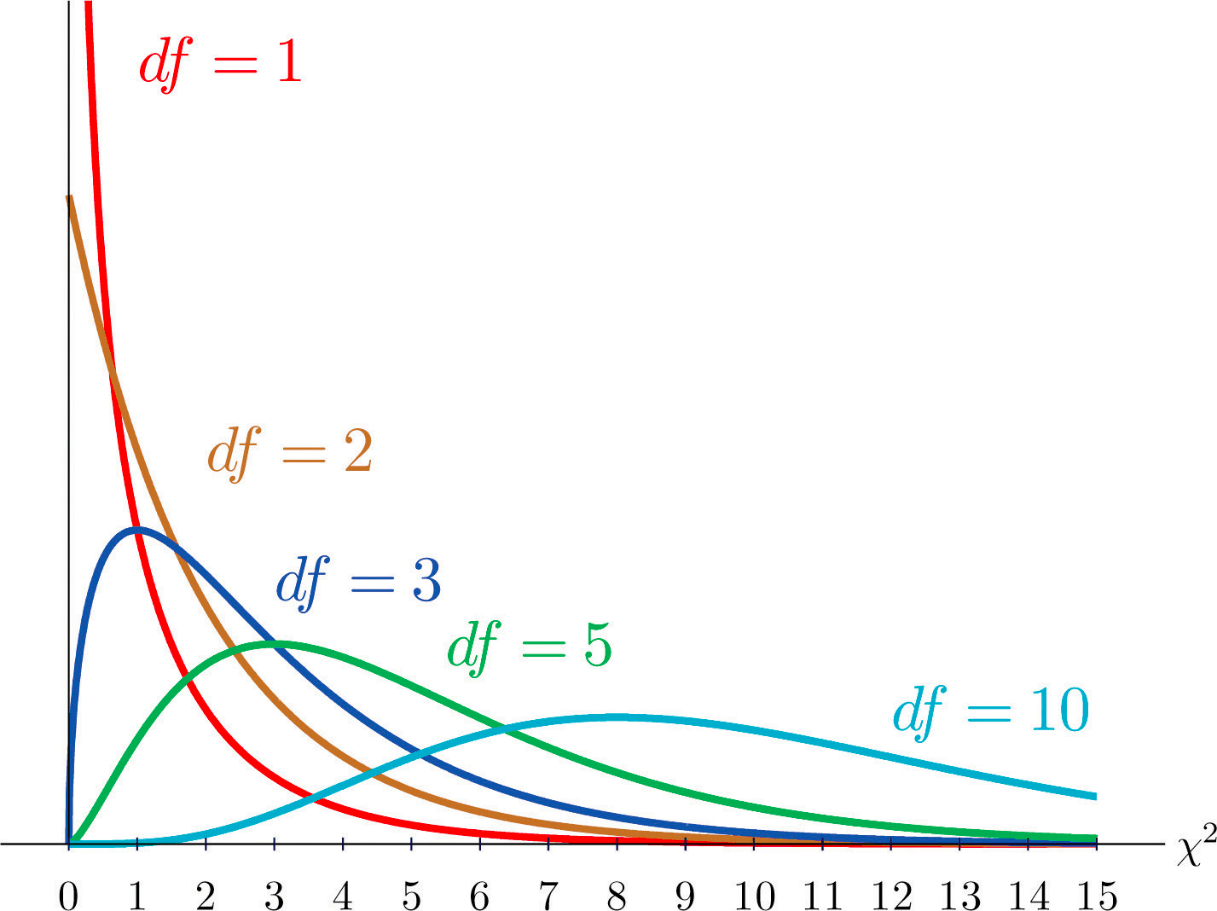
P-value
df = k - 1 (k: number of categories)
Interpret
P < α
So we reject the null hypothesis and have evidence to support the claim that at least one grade proportion does not fit the expected distribution
Chi-Squared Test of Homogeneity or Independence/Association
Two categorical variables
Homogeneity
Do two or more sub-groups of a population share the same distribution of a categorical variable (each group has its own sample)
Do people of different races have the same proportion of smokers to non-smokers.
Do different education levels have different proportions of Democrats, Republicans, and Independent
Independence/Association
Determining whether two categorical variables are associated (variables from a single SRS)
Is there an association between race and smoking status
Is there an association between education and voting preference
Practice Question 2
Girls and boys at an elementary school were sampled and asked about their favorite subject
- Does favorite subject differ by gender?
| Favorite subject | Boys | Girls | Total |
|---|---|---|---|
| Math | 96 | 295 | 391 |
| English | 32 | 45 | 77 |
| Social Studies | 94 | 40 | 134 |
| Total | 222 | 380 | 602 |
Hypothesis
H0: favorite subject does not differ by gender
H1: favorite subject does differ by gender
Expected
- Row Total * Colum Total / Total
Conditions
For each sub group, the sample is a SRS
NO expected cell counts are < 5
Calculate
Calculate by calculator


P-value
- df = (r-1)*(c-1)
Interpret
P < α
So we reject the null hypothesis and have evidence to support the claim that favourite subject is different between boys and girls
- Is favourite subject associated with gender?
H0: There is no association between favorite subject and gender
H1: There is an association between favorite subject and gender
Practice Question 3
You are playing a dice game with a friend. They brought a 6 sided die that you think may not be fair. You conduct an experiment to determine if it is fair. You roll the die 100 times and get following:
| Side | 1 | 2 | 3 | 4 | 5 | 6 |
|---|---|---|---|---|---|---|
| Frequency | 17 | 24 | 15 | 22 | 12 | 10 |
Hypothesis
H0: P1 = P2 = P3 = P4 = P5 = P6
H1: at least one is not equal
Expected
- 1/6 = 0.1667
Conditions
Random
Independent
Expected counts are greater than 5
Calculate
Calculate by calculator
Interpret
P > α
So we fail to reject the null hypothesis and do not have evidence to support the claim that the die is unfair