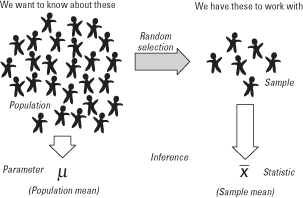
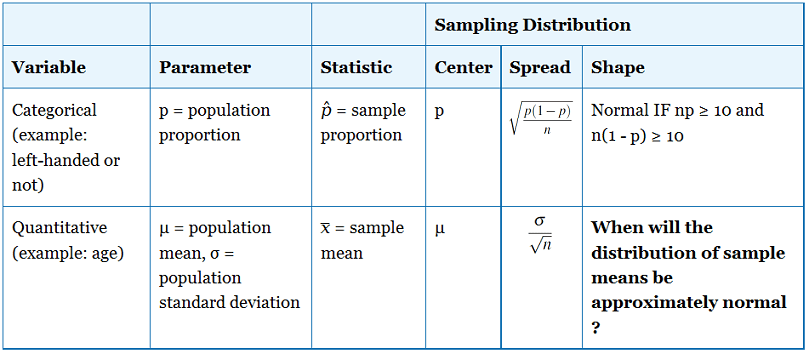
Parameter vs. Statistic
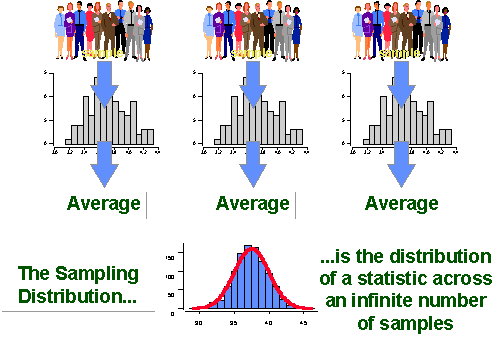
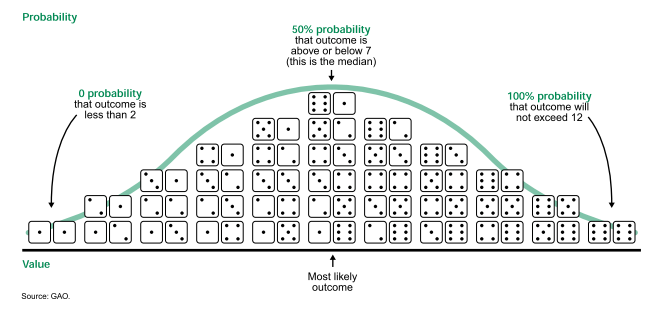
Sampling Distribution
The "sampling distribution" is the values taken by the statistic in all possible samples of the same size from that population
The "sampling distribution" is always referring to the distribution of the sample
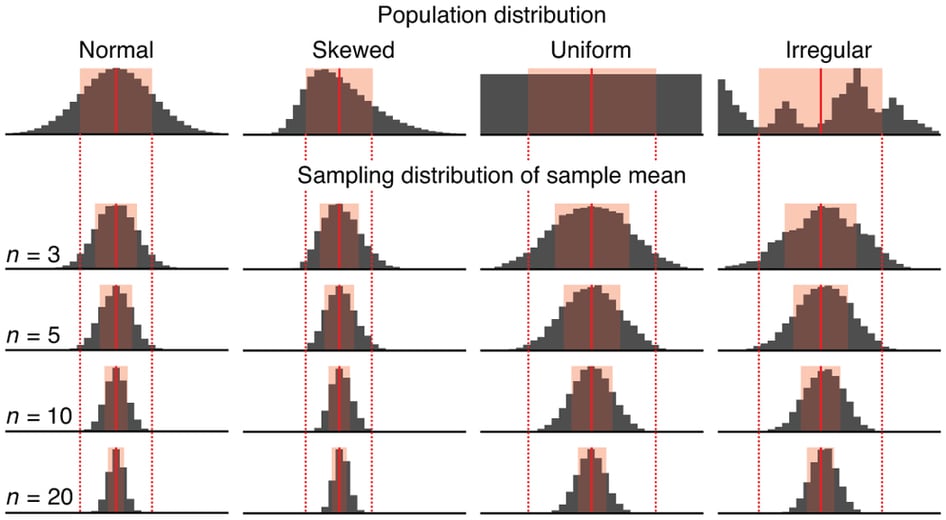
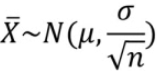
Central Limit Theorem
The sampling distribution of the sample mean is normally distributed
Conditions (RIN)
Random
- How the sample is selected
Independent
N≥10n
N: population size
n: sample size
Normal
For means

If the population is normally distributed, n can < 30
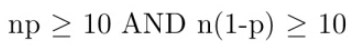
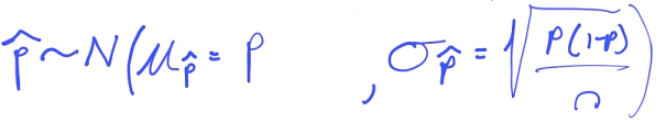
For proportions:
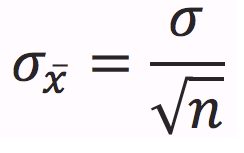
Sampling Distribution of a Sample Mean
Sampling Distribution of a Sample Proportion

Review
Practice Questions
Assume graph X represents the actual distribution select which graph the sampling distribution of the sample mean look like, for a sample size of n = 50?
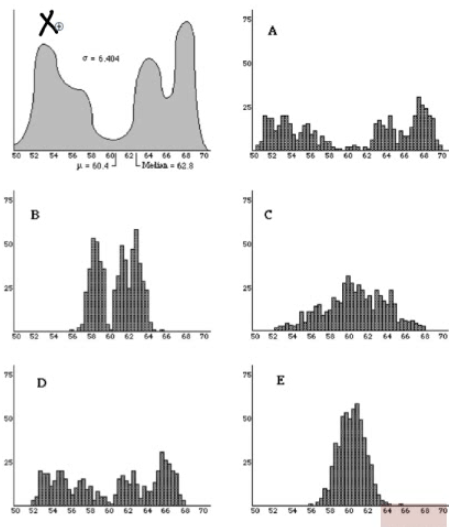
- Answer: E
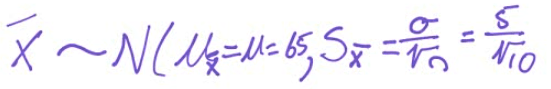
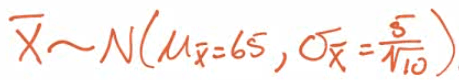
- The weight of the eggs produced by a certain species of chicken is Normally distributed with mean 65 g and standard deviation 5 g.
If a farmer selects a random sample of 10 every morning to check the health of his laying hens, what is the mean and SD of the sampling distribution of the weight of the eggs?
Calculate the probability that a randomly selected egg weighs between 61g and 69g
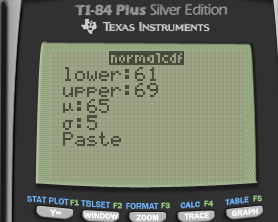
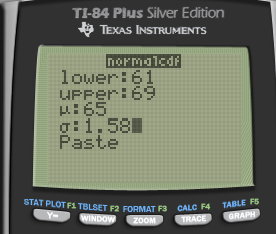
Calculate the probability that the mean weight of the farmers 10 eggs falls between 61g and 69g.
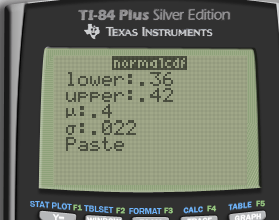
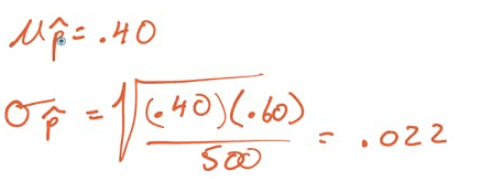
- A survey asks a random sample of 500 adults in California if they support an increase in the state sales tax of 1%. Suppose that 40% of all adults in California support the increase.
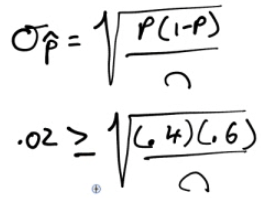
If p hat is the proportion of the sample who are in favor of the increase, what is the mean of the sampling distribution of p hat? The SD?
How large a sample would be needed to guarantee that the standard deviation of it is no more than 0.02?
Find the probability that p hat is between 0.36 and 0.42