Measuring Center
Median
The middle number
The median is resistant to outliers
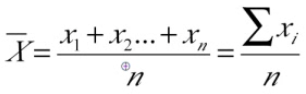
Mean
- The average number
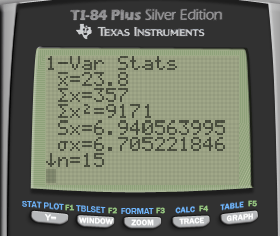
Calculation
- STAT + CALC + 1
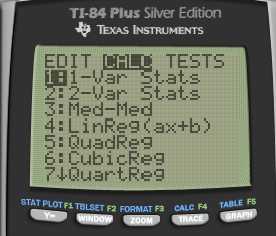
2ND + 1 (L1)
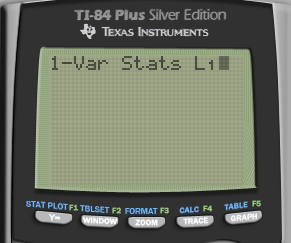
Enter
Measuring Position
Percentiles
Percentage of observations your value is above
30th percentile is the value below which 30 percent of the observations may be found
Take the average if there are two values
Quartiles
Q1 = first quartile = 25th percentile
Q2 = median = 50 th percentile
Q3 = third quartile = 75th percentile
Measuring Spread
Range
- Highest - Lowest
IQR (Interquartile Range)
- Q3 - Q1
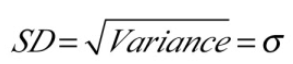
Variance / Standard Deviation
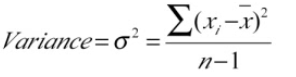
Use Sx in the TI-84 calculator

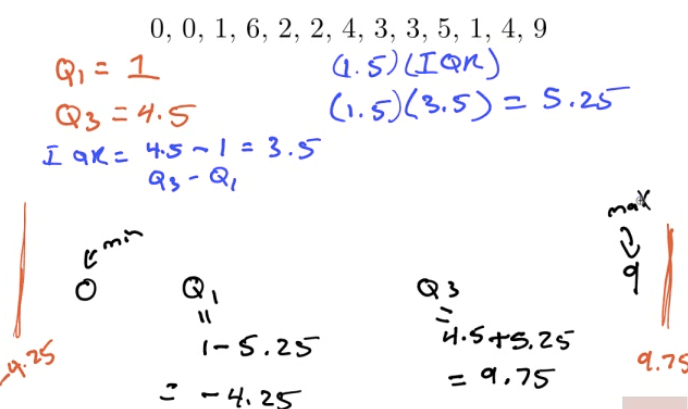
Outliers
1.5 * IQR rule
Q1 - 1.5 * IQR = Bottom fence
Q3 + 1.5 * IQR = Upper fence
Outside the "fence" = Outlier
Example
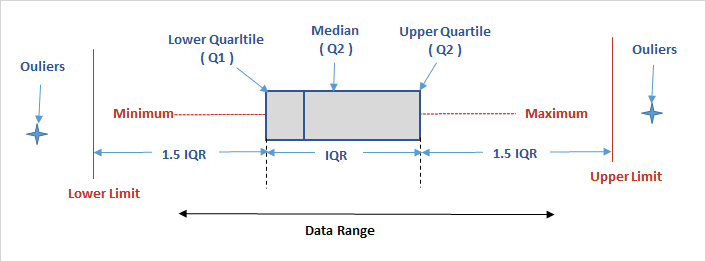
Boxplots
Graph of the "5-number Summary"
Min Q1 Median Q3 Max
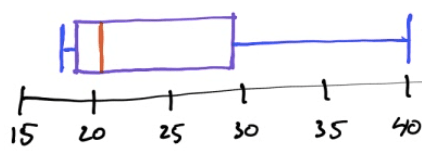
Example
18, 18, 17, 27, 22, 19, 20, 21, 18, 35, 32, 40
Min: 17
Q1: 18
Median: 20.5
Q3: 29.5
Max: 40
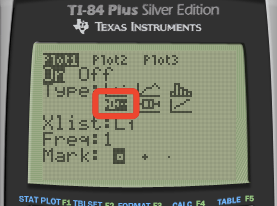
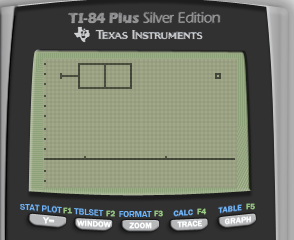
Calculator
- Boxplot
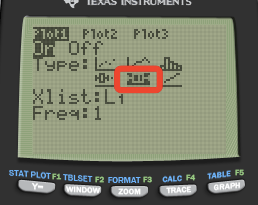
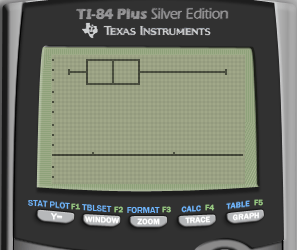
Modified Boxplot
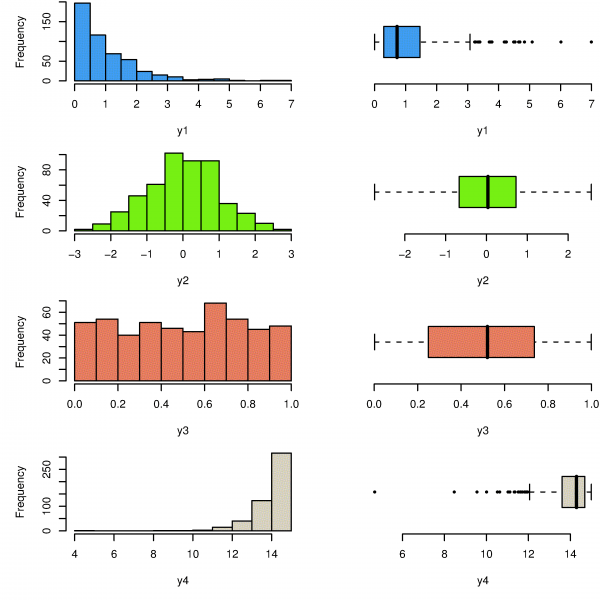
SOCS
Shape
- Skewed left/right
Outlier
Q1 - 1.5 * IQR
Q3 + 1.5 * IQR
Center
- Mean or Median
Spread
- SD or IQR
Example
18, 18, 17, 21, 26, 40, 23, 27, 22, 19, 20, 21, 18, 35, 32
Skewed right
No outliers
Centered at a median of 20.5
A spread of IQR = 11.5
The Effect of Changing Units on Summary Measures
Linear Transformations
Xnew = A + B * Xold
A: only affect mean and median
B: affect all
Examples
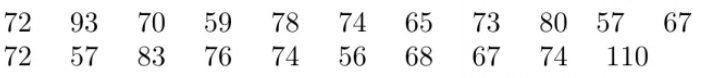
Construct a modified boxplot for this data set
Min = 56
Q1 = 66
Med = 72
Q3 = 77
Max = 100
IQR = Q3 - Q1 = 11
IQR * 1.5= 16.5
Bottom fence = Q1 - IQR * 1.5 = 49.5
Upper fence = Q3 + IQR * 1.5 = 93.5
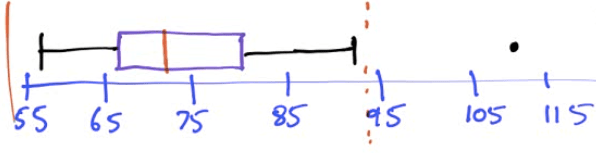
Describe the distribution of test scores
Symmetric
One outlier at 110
Centered at a median of 72
With a spread of IQR of 11